Enumerated and Analytical Statistics
Deming often spoke about the need for management to understand the difference between enumerated and analytical statistics. Statistics based on enumeration produce information. It tells us what we have, how much, or how many. Surveys of customers or employees are enumerated studies. Censuses are based on enumerated statistics. An analytical study aims to improve the process that produced the material studied based on historical information. Using analytical statistics, we can learn something that will help us improve future products or services.
Management of IT tends to focus more on enumerated data than analytical data. As part of a Modern Governance process, we tracked test coverage deployments in a software supply chain for 25 weeks, Monday through Friday. With this data, we can determine how many test coverage fails have occurred over this period by looking at enumerated summaries, distributions, and plot charts. These charts do not, however, provide insight into the process. The following is a list of 25 weekly observations of a TDD_Fail count. All of these graphs used in this post were created using the same data.
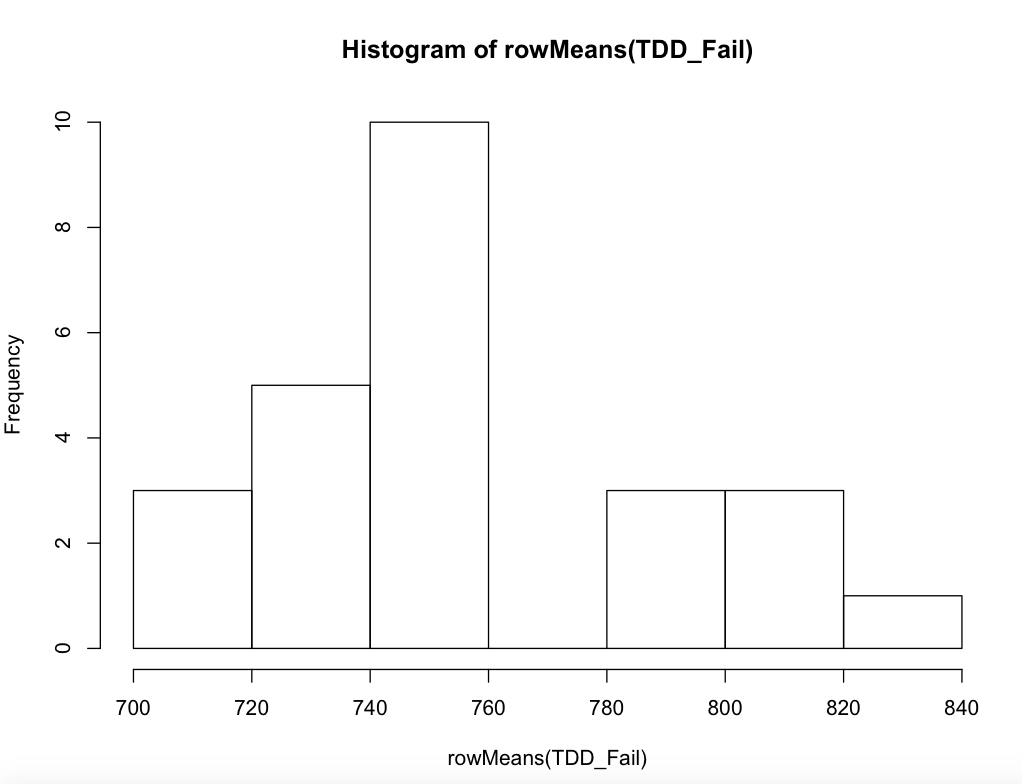
The histogram shows us the distribution of TTD_fail's, but it doesn't help us analyze different patterns that can help us better understand why the data is being produced. When trying to understand a processes improvement an enumerated view like a histogram might not give enough information for a subject matter expert to further investigate. In 1938 Dr. Walter Shewhart published his Statistical Method from the Viewpoint of Quality Control. Shewhart created a tool called Statistical Process Control, which uses control charts to produce analytical, statistical methods. A control chart helps to formulate rational plans of action. The following control chart provides a wealth of visual information to further investigate the process's improvement, in contrast to the histogram of our TDD_Fail data.
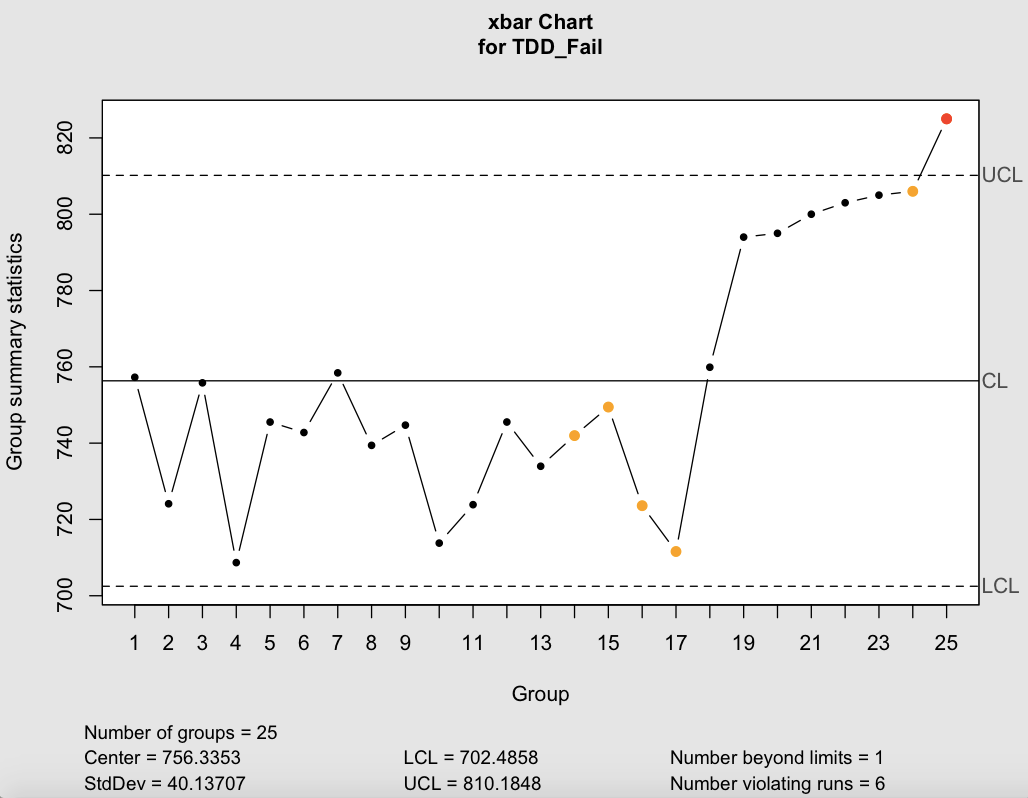
The red observation 25 is the first thing we observe on the control chart. Because this observation is above the upper control limit (UCL), it is a statistical anomaly. Control charts display three sigmas from the mean by default. This variation was called a Special Cause variation by Deming. An assignable cause is assumed to produce variability when a point falls outside the control limits, so more inspection is needed. On the control chart, some not-so-obvious patterns are more interesting. Deming called these patterns common cause because they are patterns that are part of the process. The red observation 25 might have been an anomaly or a specific assignable cause. A common cause example can be seen in the pattern of observations 18 to 24. Notice how they are all trending upward. The deployments for those six weeks resulted in more TDD_Fails than average for the rest of the weeks for the total 25 weeks. Further investigation might reveal that a new development team has been added to the service, and they have not been properly trained on TDD. The histogram (enumerated) analysis would not have led us to that investigation.
The histogram and control chart illustrates the difference between an enumerative study and an analytical study of a process.